Using LogRocket for Front End Monitoring and Analytics
Analytics tools are a great asset to any engineering and product team. Analytics provide you (and your greater team) information about your proudct as well as help when debugging an issue. LogRocket is an awesome tool that can be used for replay, performance monitoring, and general anaylsis of your Front End projects.
In this post, I’m going to discuss at a high level how LogRocket works and showcase some examples from a sample project. Before diving into my post, I recommend checking out the LogRocket introduction docs that cover the basic usescases and how you can utilize this in your project.
How do you get started?
Similar to tools like Google Analytics, connecting LogRocket to an existing project first requires an account. LogRocket has some great documention on how to get started with this at https://docs.logrocket.com/docs/quickstart.
Once you’ve created an account and installed the logrocket package as a depdency you just do the following:
import LogRocket from "logrocket";
LogRocket.init("app/id");
According to the documentation, you should do this as close to the entrypoint of your application as possible. So for example in a React App, you would likely put this in the index.tsx file since that is the first place that is loaded in your project.
Once you have it wired up with an account, your sessions will be recorded and you can view them in your dashboard. This even works with localhost if you are running an application and want to see it in action before deploying.
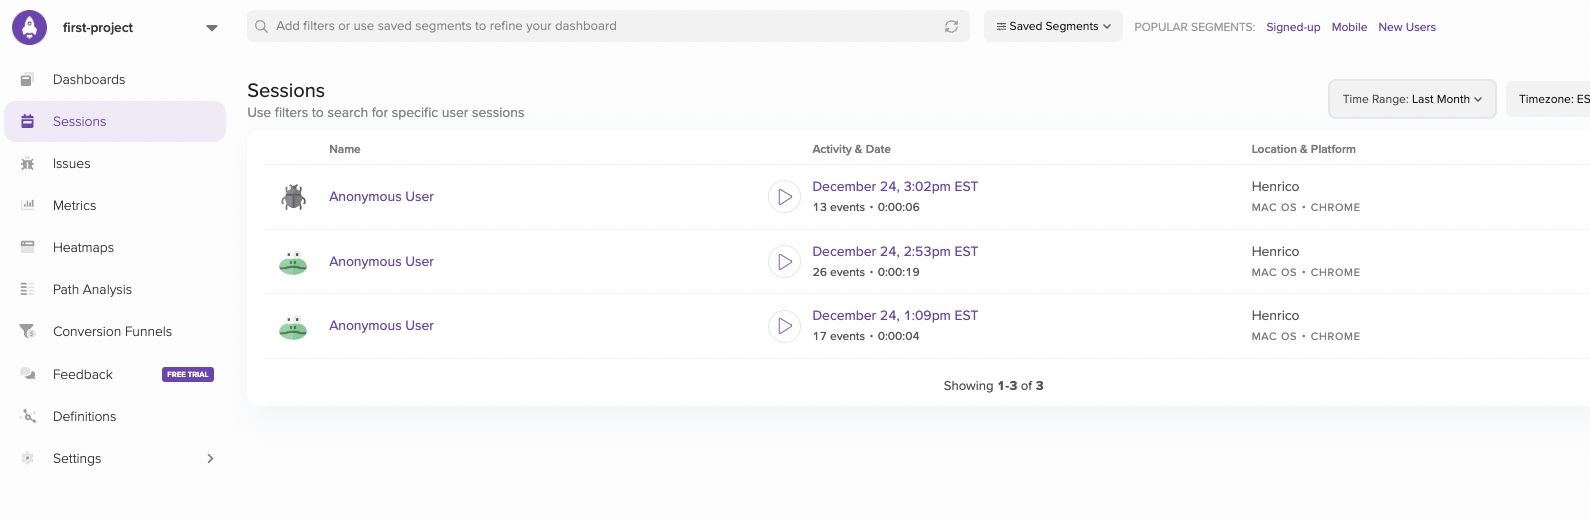
What information can you get from sessions?
There is a lot of information that can be easliy pulled from each session. The following are some high points to get started.
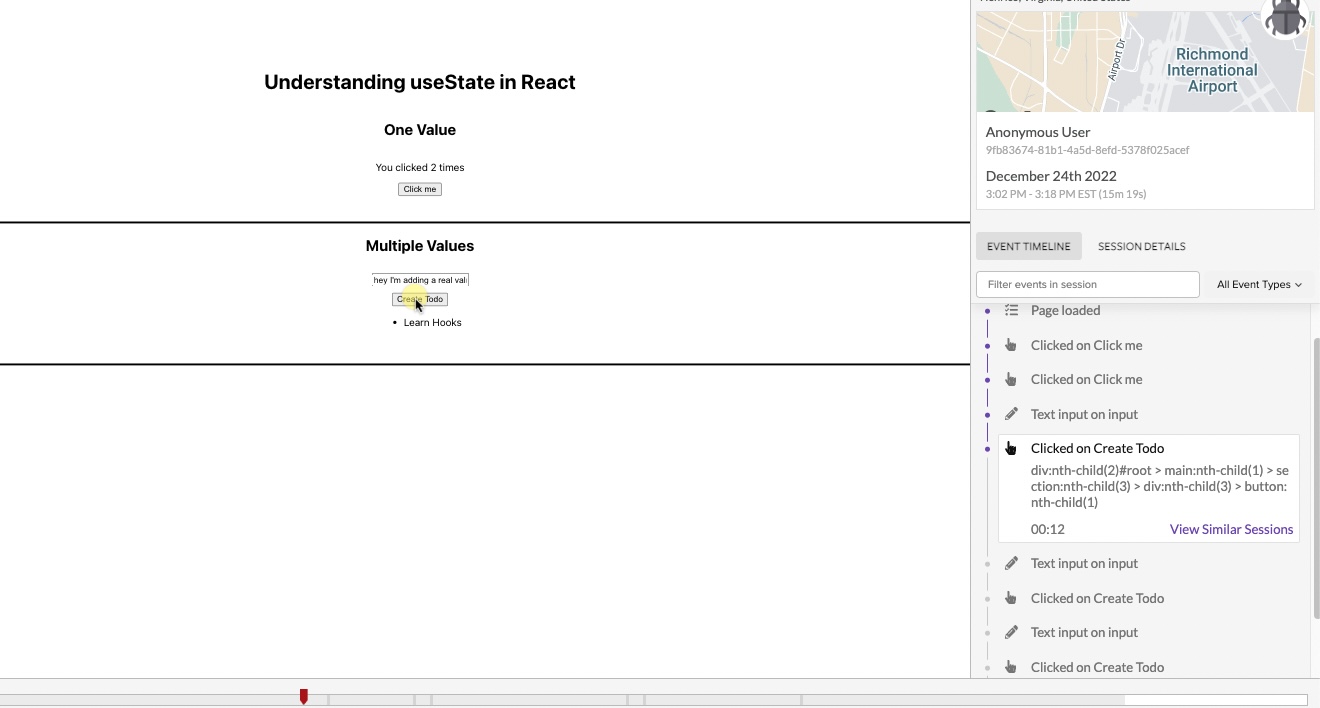
You can get standard playback as well as detailed information about was done and when:
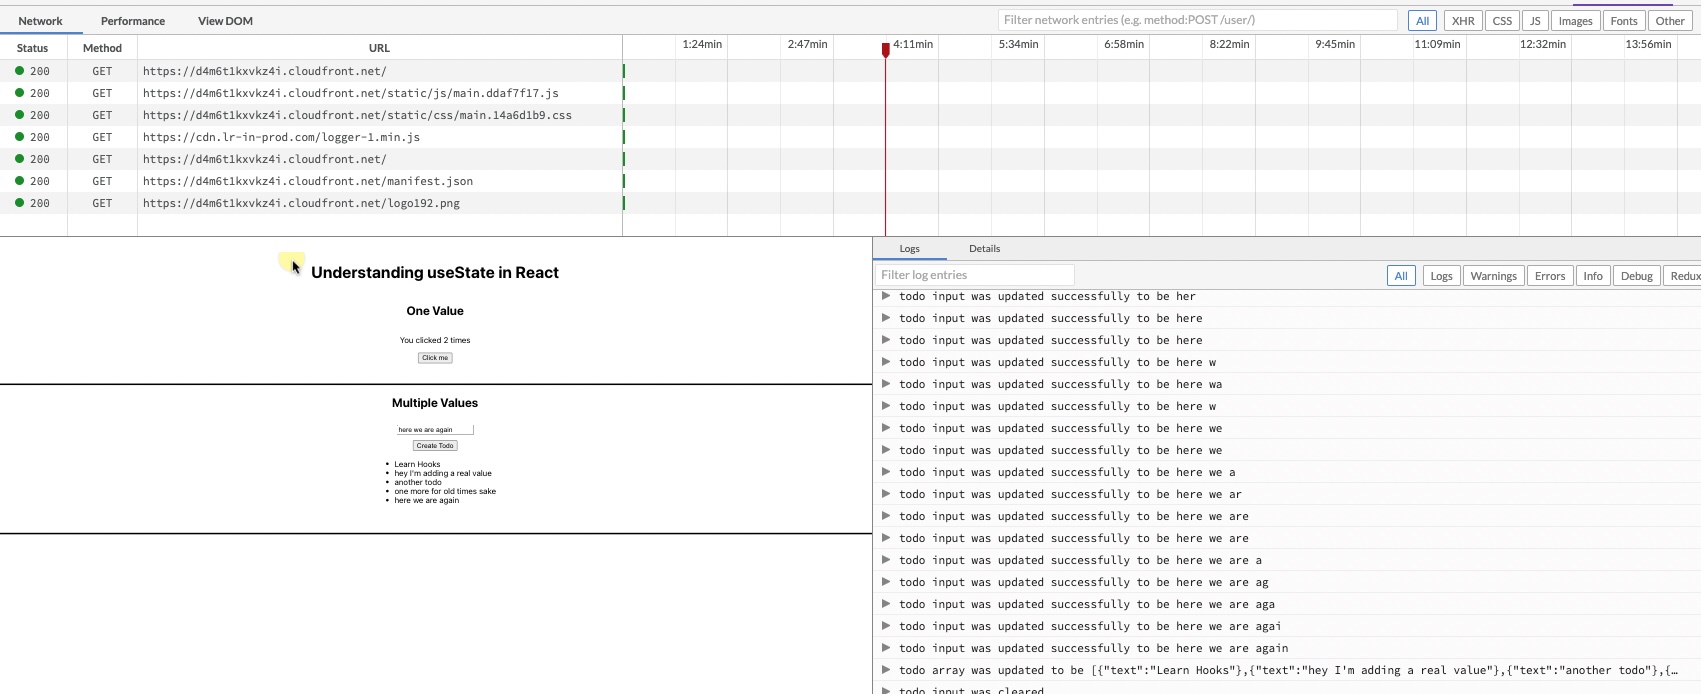
You can also get detailed information for developers including API calls at general performance information:
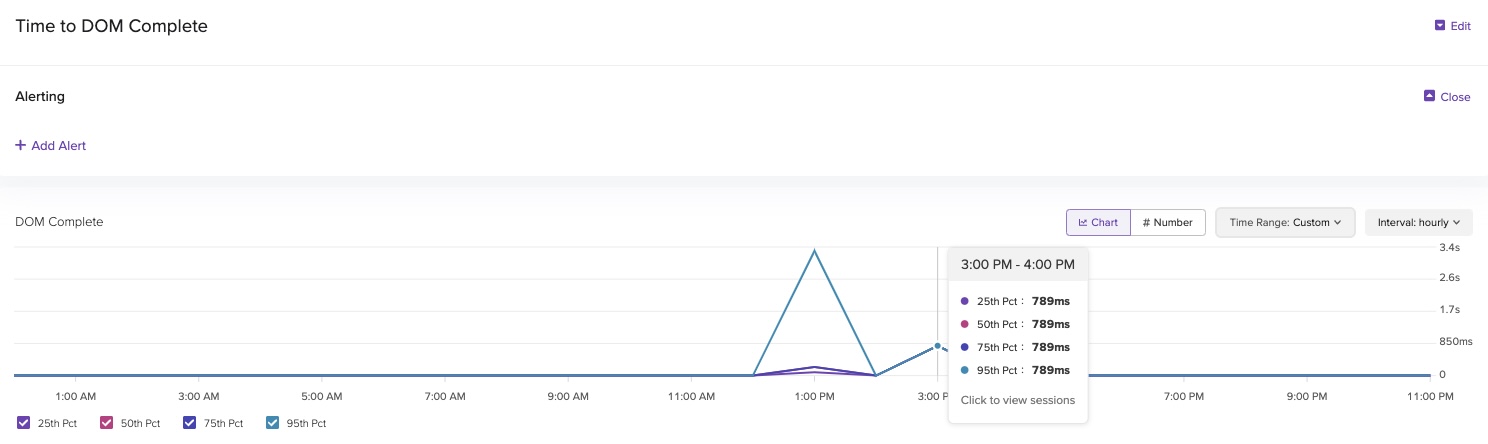
You can also create custom metrics and have access to performance considerations like time to DOM complete:
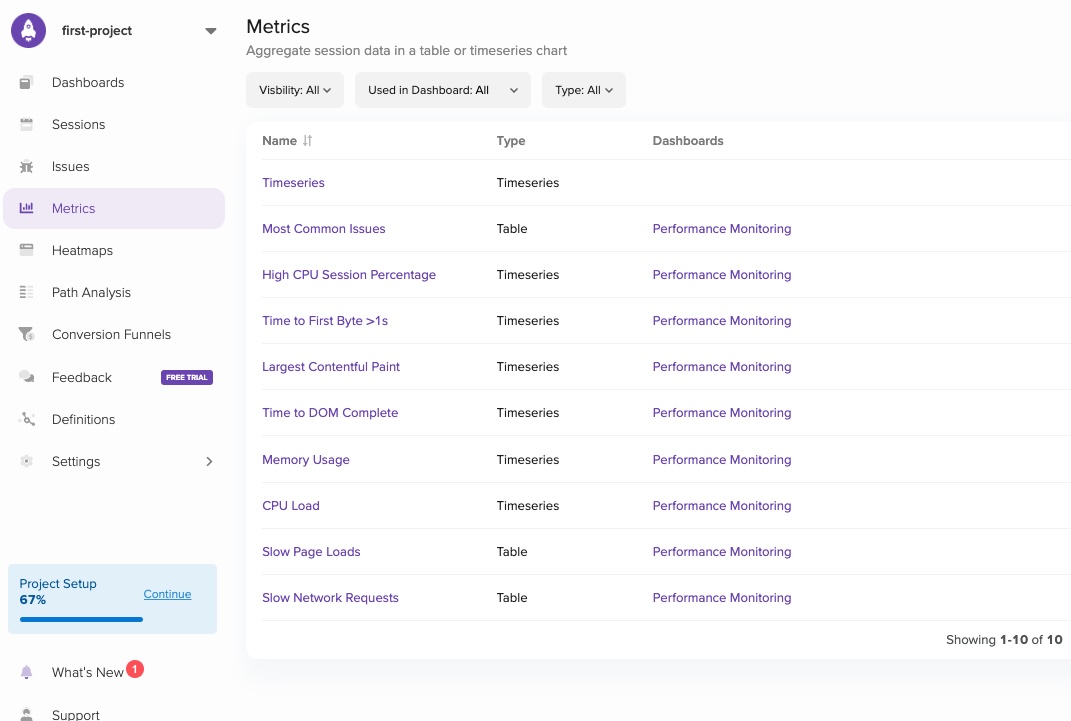
If you open one of these metrics, you can get more detailed analysis with time series charts laid out:
How does it compare with other tools?
As a long time user of Chrome’s Profiler I can really appreciate any simplicity of the runtime information. One of the nice parts of this tools is that it provides information in a easy way to consume and share.
It is really powerful to be able to see what a user did direclty, and then be able to use it in debugging. The replay feature of the product alone is something that could be very valuable to any team.
Its also nice because you can track custom events. You basically just call the track() function provided from the npm package anywhere in your application you want to track a specific event. Then this event you can pull up in the dashboard and review later.
There are also multiple integrations that you can connect with well known services like Google Analytics, GitHub, Splunk, and Trello among others. Check out the docs on integrations at https://docs.logrocket.com/docs/integrations.
Wrapping up
I know this post was fairly brief, but I just wanted to share some information about this product. I recommend checking out the links or contacting LogRocket directly for more in depth information.
Thanks for reading my post!